The Ultimate Command Center
The OffConversion dashboard aggregates leads, ad spend, won revenue, and performance metrics from every connected platform into a single, real-time overview. No more exporting CSVs from Google Ads or Meta Business Manager to prove your value.
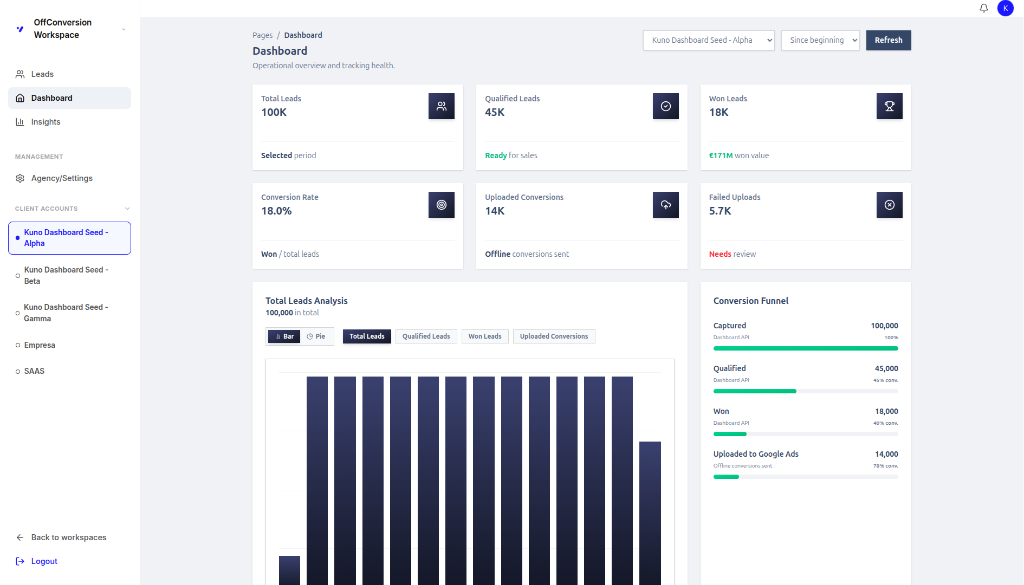
Your agency's complete pipeline visibility
Everything you need to report with confidence
Instant KPI Clarity
The top of your dashboard highlights exactly what your clients care about. View total leads, qualified leads, and actual won leads at a glance.
Crucially, we provide deep insights into your pipeline's health, tracking your overall Conversion Rate, the total Value Won, and giving you live visibility into your Uploaded Conversions.
Period-over-Period Growth
Compare any two date ranges side by side. Answer the question "Are we doing better than last month?" instantly.
Comparison data overlays automatically on all time-series charts and adds percentage change indicators to your KPI cards, making client meetings a breeze.
Deep Channel Breakdowns
Break down your performance by 5 different dimensions: Platform (Google, Meta, LinkedIn), UTM Source, Medium, or specific Campaign.
Visualize your data through stacked bars, conversion funnels, and win/loss ratio donuts. Know exactly which specific ad group is driving the most valuable deals.
Built-in Portfolio View for Agencies
Manage multiple client workspaces? Switch to the portfolio view to aggregate metrics across all your client accounts. See the total ad spend managed by your agency and the total revenue generated for your clients in a single, powerful server call.
Automatic Ad Spend Syncing (In Development)
Forget manual CSV imports at the end of the month. Ad spend data (cost, clicks, impressions) is pulled directly from the Google Ads and Meta APIs every single day. Your Cost Per Lead (CPL) and Pipeline ROAS metrics are always 100% accurate and up-to-date.
- Google Ads Cost Sync
- Meta Ads Cost Sync
- Microsoft Ads Cost Sync
- Live ROAS Calculation